About us / Archive
The path to visualisation and SCADA
Early experience with visualisation, data acquisition and PC-based control.
SCADA – Supervisory Control And Data Acquisition: systems for industrial monitoring, control and data acquisition.
When controlling processes with PLCs, it makes sense to use their PC connectivity. A complete solution therefore also needs the ability to operate the system from a PC.
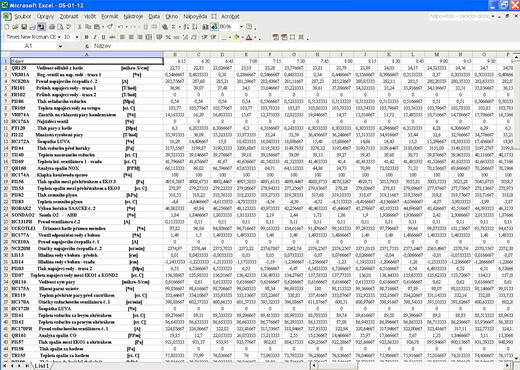
In 1996 I developed a gas-boiler visualisation for Honeywell using VB in Excel; the original account states 110 t/h and 64 MPa. The Honeywell TDC3000 system generated data on request and transferred it to the PC as text files. These supported process displays, trends and historical data across a PC network for around 150 points. It was still operating when this account was written, but technology had moved on. I considered continuing with Excel through an OPC server, then compared SCADA packages instead. The requirements were a good price, extensive functionality including controlled Excel exports, and a working demo without a time limit for testing. Excel export mattered because energy departments commonly work with 15-minute average values. Daily and monthly files are useful for management, and other exports can be created as needed. SCADA Reliance 3 met those requirements, with an attractive price, extensive features, a Czech manufacturer and several thousand licences already sold.
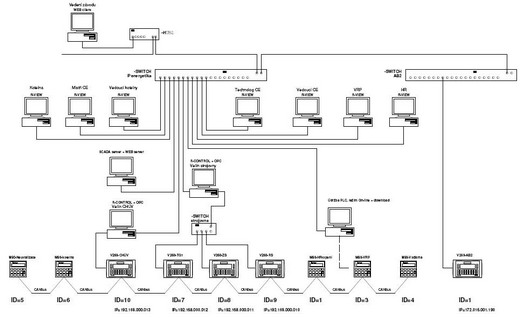
In 2005, the JIP-Větřní energy control system was extended to include 6.4/1.2 MPa and 1.2/0.3 MPa steam pressure-reducing stations and a 15 MVA back-pressure steam turbine. PLCs communicate rapidly with each other over CANbus and are also networked by TCP/IP. SCADA Reliance 3 provides visualisation, monitoring and operation of the connected processes from designated workstations. One PC serves as a data server for scripts, backups, central maintenance and archiving. Connected areas included the boiler house, turbine hall, main substation, chemical water treatment, wastewater neutralisation, waterworks and compressor station. Existing controls can be integrated to different degrees as required. Senior management could also access the energy plant through Internet Explorer.
The control-system topology at the time:
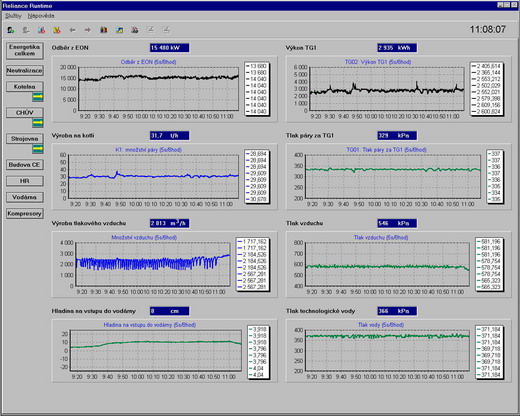
Screenshots from the completed project:
Floating charts show the process as it happens:
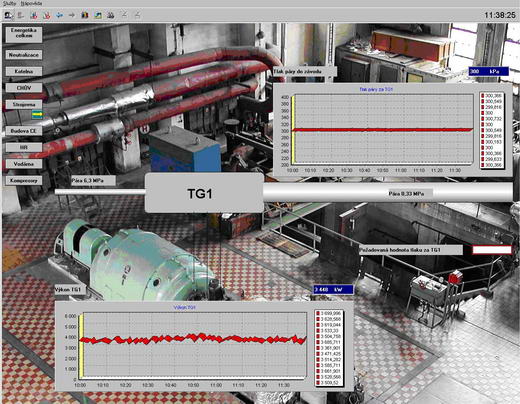
Data can be overlaid on photographs of the equipment:
Controls change dynamically according to settings such as automatic or manual mode:
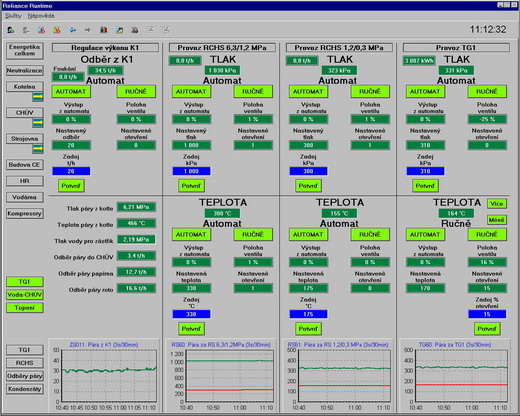
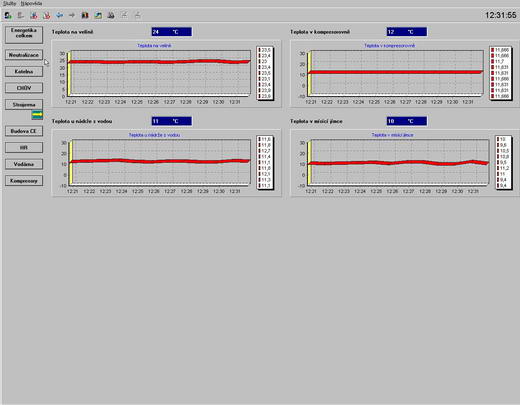
Heated-space temperatures can also be monitored at little additional cost:
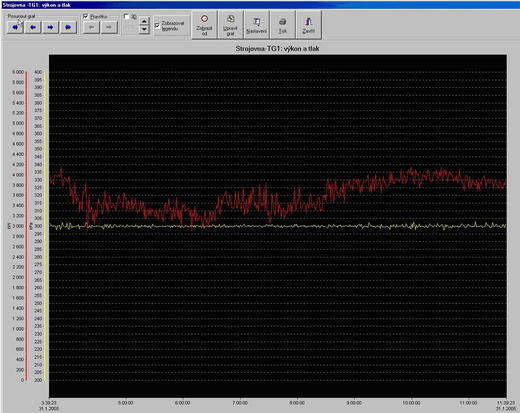
When needed, we can look back at yesterday’s or last month’s operation:
Numerical values can also be displayed and exported to Excel:
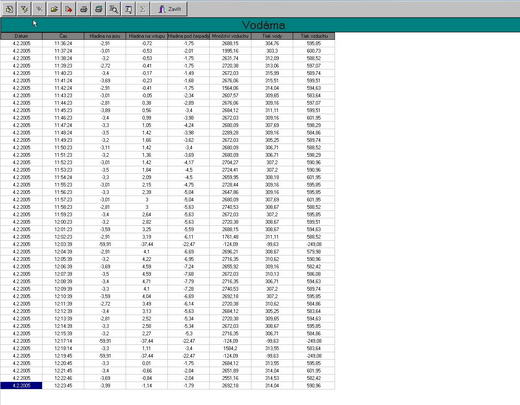
Daily Excel files containing 15-minute values are useful too: